How to Build, Train and Deploy Your Own Recommender System – Part 2
We build a recommender system from the ground up with matrix factorization for implicit feedback systems. We then deploy the model to production in AWS.

In Part 3, we have looked into the metrics that make up Lighthouse, now we have a more complete idea of what they mean. Now let us step back from all those technical details, and visit case studies, and see for ourselves how an improvement in website and webpage performance affects the business.
There are a lot from where these came from, however I have only picked a handful for our examples.
Carousell, a Singapore-based online selling platform, was widely regarded as a the eBay of Asia a couple of years ago , and when they wanted to spread to other parts of Asia like Indonesia and the Philippines. However the main issue they were having was that at that current state where their website took more than 15s to load, there was no way for them to acquire and retain new users as they plan to spread all throughout Asia.
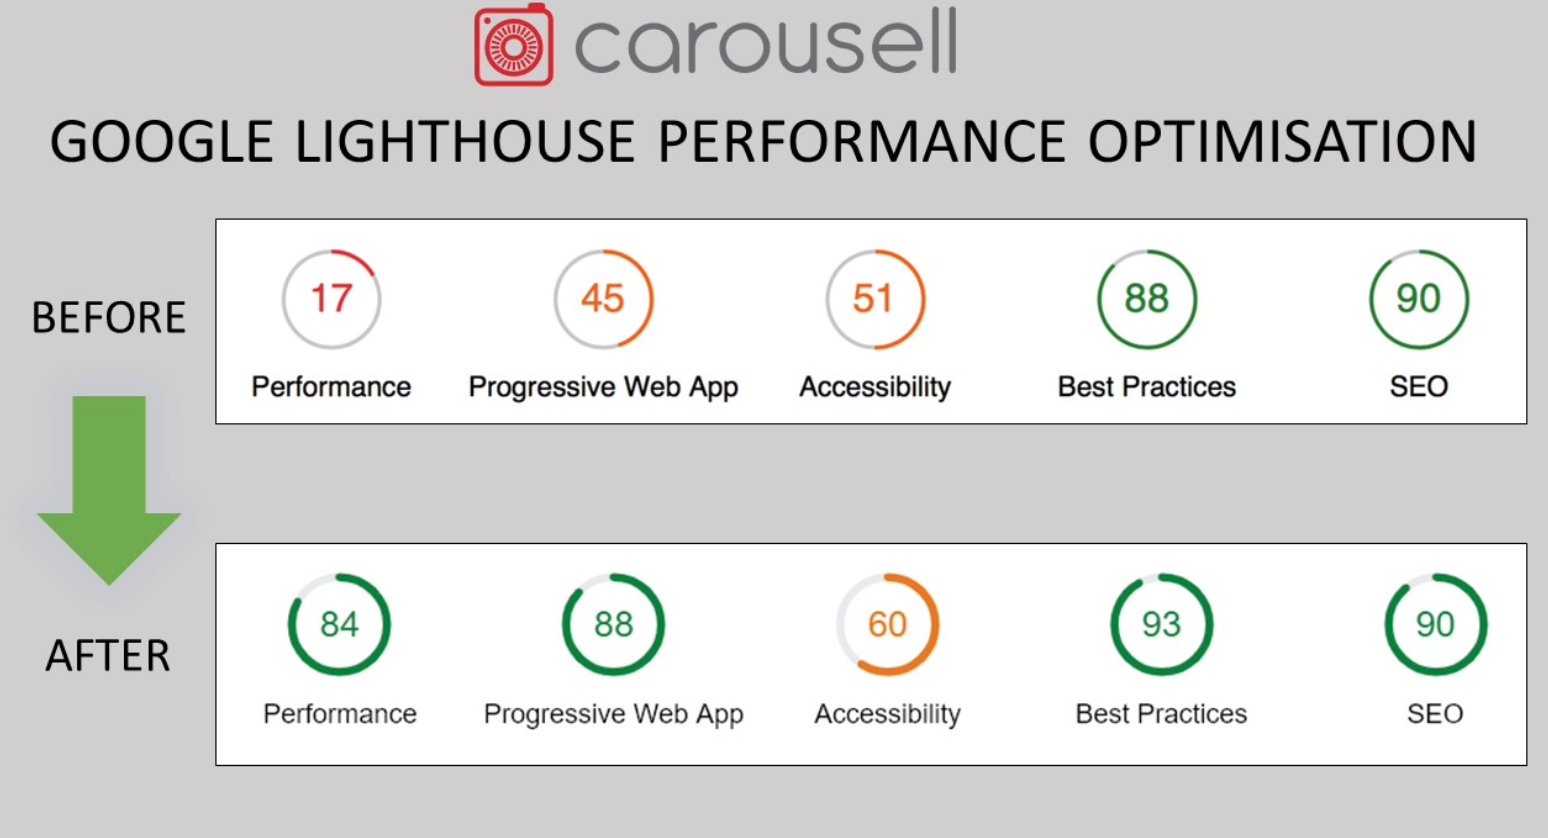
Their team embarked on what the call performance-first web experience, because according to them good user experience is fast and delightful user experience. They improved their PWA performance by using a more effective cacheing system, streamlined their service worker usage, a better image compression, and CSS inlining.
As a result of all these changes, their page was able to load in 6 seconds, whereas before the changes, it was more than 16 seconds, and increased their organic traffic by 63%!
This was an older post, however the principles remain the same. Many years ago when YouTube was still not as pervasive as it is today, one of the engineers was complaining why the main view page has ballooned to 1.2MB and dozens of requests. And around that time someone was able to create a Quake clone in under 100KB, so there was no reason why it couldn’t be done. So Youtube created that prototype and tested it with a percentage of their users.
At first the results were baffling, their loading time actually slowed down. But after more analysis, they found out that their results were skewed because now they had data from places around the world that had never been able to load Youtube before, places with poor mobile connectivity like Southeast Asia, South America, Africa and Siberia.
This goes to show that
page weight mattersand it is inversely proportional to the speed of page load.
This next case study did not use my recommended tool of choice Lighthouse, but a competitor product Dareboost. It doesn’t really matter that much whatever tool you end up using, as long as you are consistent so that you can readily compare you past results and track your progress.

So yeah, Radins used Dareboost to monitor their website performance progress. In here, you can track their progress as they improved their Speed Index reading to below the recommended 1000, which eventually improved their conversion rate up by 12%. And this is not even changing any UX for any of the pages, just basic page speedup activities.
Improving conversion rate by simply speeding up the page loading, wow, that seems like a cheap investment that anyone can do!
Without achieving organizational alignment and getting the buy-in from the relevant stakeholders it is next to impossible to be able to prioritize performance improvement related projects.
For some companies, there is full support from the upper management. For online flower site 1800flowers.com, a technical savvy CMO leads a cross functional team made up of product experts, marketing, analytics, design and development, and treat the department as cross between marketing and technical development.
Having clear mandate from the big boss, everyone working in the team are in complete alignment, making their drive to better performance easier than if their organizational structure was different. And because everyone’s all-in, the undertaking was not treated as a side project, but rather resources and time was dedicated to it as the project was highly prioritized.
For online flight booking provider justfly.com they don’t have the luxury of the top-down approach that 1800flowers.com have, instead they took it upon themselves in the engineering team, and even without the mandate from the management, managed to convince them and relevant stakeholder on their side. How did they do that? By taking on bite-sized POCs and experiments, they used the data produced by such activity to enable that organizational alignment required to get the performance ball rolling in their favor.
Once we have achieved buy-in from the stakeholders, we actually have to build the actual project. This section is not to detail the HOW of doing these performance improvements. Whenever you run tools like Lighthouse or Dareboost, it will present recommendations on the actions to take to fix the all the issues. And the required actions can be varied and depend on the technology being currently used. So we will skip discussing these technical details, as I will be covering some of them in future posts.
For Asian online marketplace Carousell.com, they started with an aggressive performance budget which they have integrated with their CI/CD with complete integration with notification system where the results are shared with everybody. Because it is all integrated and automated, it gives the team immediate feedback on what changes represent progress and what changes represent regressions.
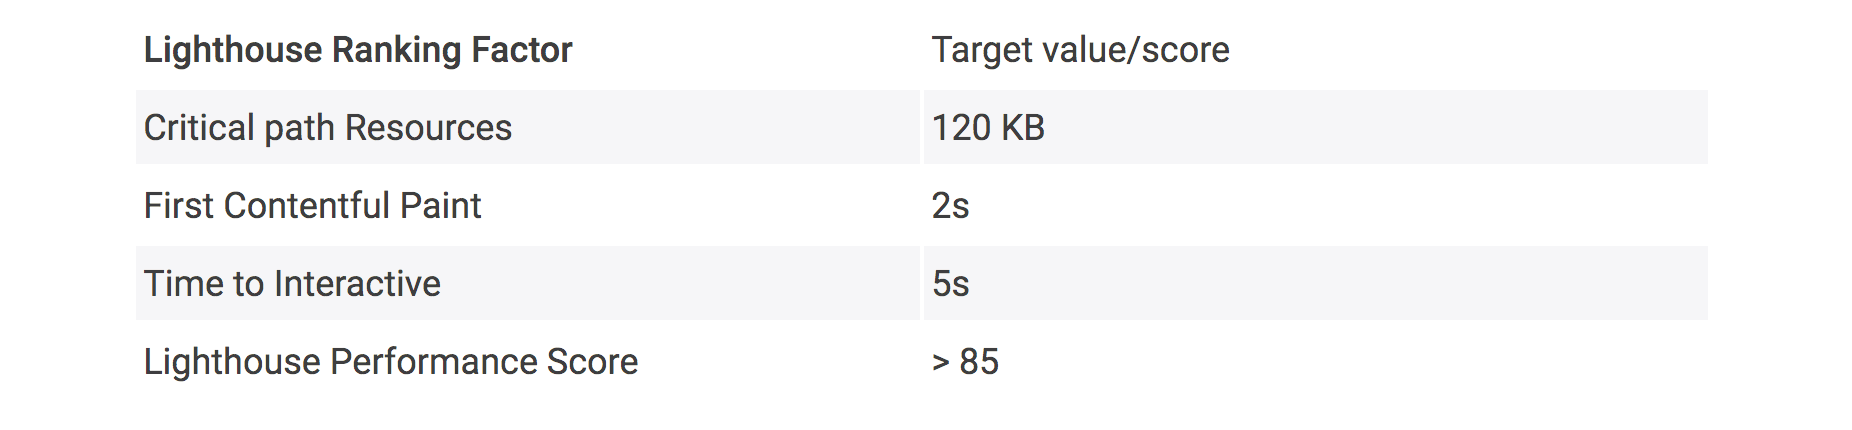
As a result of this shared goal, automated and measurable process, Carousell were able to improve their website performance considerably.
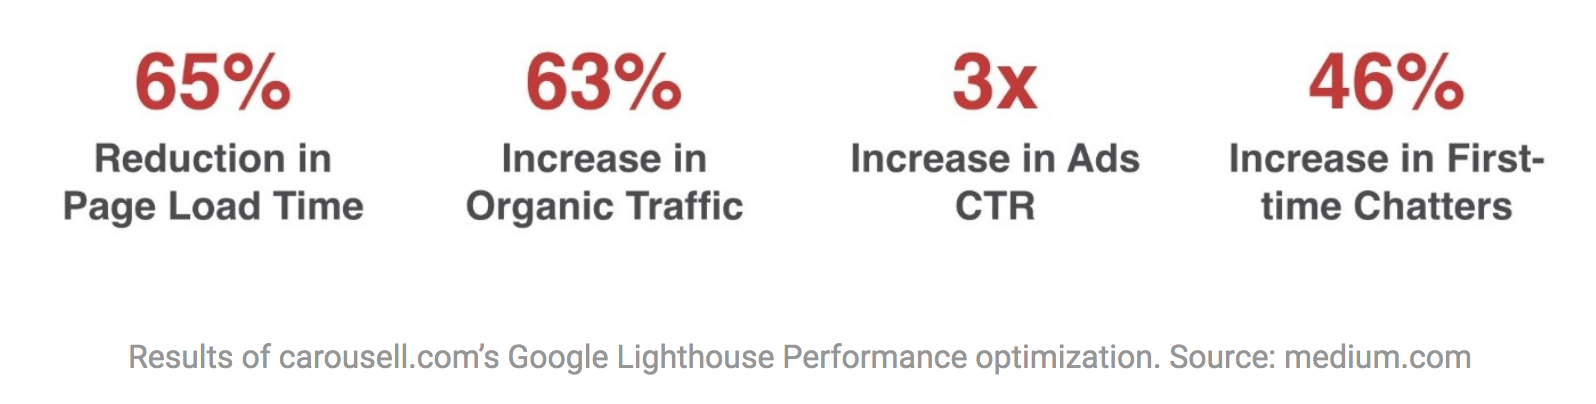
What’s good about their results is that there is something in it for everyone who were part of the project. The product team cares about the page load time. The marketing team - increase the organic traffic and improved click through rates, and the sales team cared about how many buyers and sellers actually interact with the application. Because it is a shared goal, and there is a sense of ownership of that problem, it follows that everyone concerned will gladly to take part in the formulating the solution.
So there you have it, a few case studies that demonstrate the effect of an increased performance can have on your business. The results are undeniable. A fast website will improve user engagement, increase web traffic, and decrease bounce rates.
And as we know all these are a numbers game, if you increase your visitors, you will most definitely increase your conversions, and ultimately, more $$$ for your business.
We build a recommender system from the ground up with matrix factorization for implicit feedback systems. We then deploy the model to production in AWS.
We build a recommender system from the ground up with matrix factorization for implicit feedback systems. We put it all together with Metaflow and used Comet...
Building and maintaining a recommender system that is tuned to your business’ products or services can take great effort. The good news is that AWS can do th...
Provided in 6 weekly installments, we will cover current and relevant topics relating to ethics in data
Get your ML application to production quicker with Amazon Rekognition and AWS Amplify
(Re)Learning how to create conceptual models when building software
A scalable (and cost-effective) strategy to transition your Machine Learning project from prototype to production
An Approach to Effective and Scalable MLOps when you’re not a Giant like Google
Day 2 summary - AI/ML edition
Day 1 summary - AI/ML edition
What is Module Federation and why it’s perfect for building your Micro-frontend project
What you always wanted to know about Monorepos but were too afraid to ask
Using Github Actions as a practical (and Free*) MLOps Workflow tool for your Data Pipeline. This completes the Data Science Bootcamp Series
Final week of the General Assembly Data Science bootcamp, and the Capstone Project has been completed!
Fifth and Sixth week, and we are now working with Machine Learning algorithms and a Capstone Project update
Fourth week into the GA Data Science bootcamp, and we find out why we have to do data visualizations at all
On the third week of the GA Data Science bootcamp, we explore ideas for the Capstone Project
We explore Exploratory Data Analysis in Pandas and start thinking about the course Capstone Project
Follow along as I go through General Assembly’s 10-week Data Science Bootcamp
Updating Context will re-render context consumers, only in this example, it doesn’t
Static Site Generation, Server Side Render or Client Side Render, what’s the difference?
How to ace your Core Web Vitals without breaking the bank, hint, its FREE! With Netlify, Github and GatsbyJS.
Follow along as I implement DynamoDB Single-Table Design - find out the tools and methods I use to make the process easier, and finally the light-bulb moment...
Use DynamoDB as it was intended, now!
A GraphQL web client in ReactJS and Apollo
From source to cloud using Serverless and Github Actions
How GraphQL promotes thoughtful software development practices
Why you might not need external state management libraries anymore
My thoughts on the AWS Certified Developer - Associate Exam, is it worth the effort?
Running Lighthouse on this blog to identify opportunities for improvement
Use the power of influence to move people even without a title
Real world case studies on effects of improving website performance
Speeding up your site is easy if you know what to focus on. Follow along as I explore the performance optimization maze, and find 3 awesome tips inside (plus...
Tools for identifying performance gaps and formulating your performance budget
Why web performance matters and what that means to your bottom line
How to easily clear your Redis cache remotely from a Windows machine with Powershell
Trials with Docker and Umbraco for building a portable development environment, plus find 4 handy tips inside!
How to create a low cost, highly available CDN solution for your image handling needs in no time at all.
What is the BFF pattern and why you need it.