Speeding up your site is easy if you know what to focus on. Follow along as I explore the performance optimization maze, and find 3 awesome tips inside (plus a Bonus)!
Lighthouse Metrics (in weighted order of importance)
Tool: Lighthouse by Google
To help web developers in their quest for a speedy site, Google brought us Lighthouse. You will at least need Chrome installed in your machine, and is available in a few workflows that suit you best.
In Chrome DevTools. Easily audit pages that require authentication, and read your reports in a user-friendly format.
From the command line. Automate your Lighthouse runs via shell scripts.
As a Node module. Integrate Lighthouse into your continuous integration systems.
From a web UI. Run Lighthouse and link to reports without installing a thing.
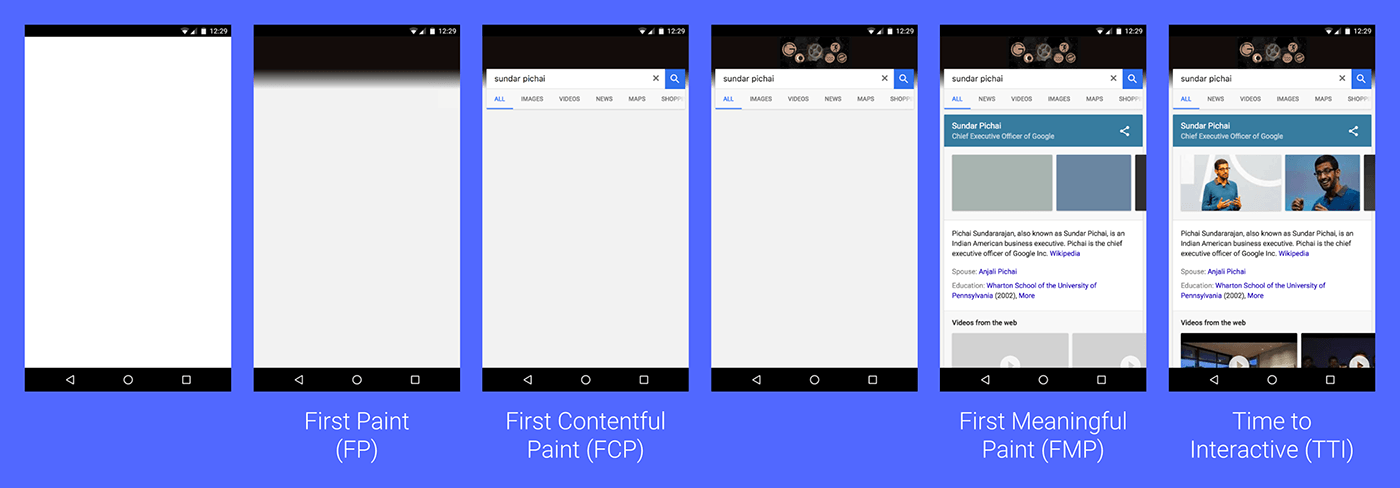
Lighthouse has 6 important metrics that contribute to the final performance score. Each metric has different weights, as a result, those that have a heavier weight contribute more. The following describes each and their corresponding weights:
Time to Interactive (TTI) (weight 5X)
TTI is the most important metric and is defined as the amount of time it takes for the page to become fully interactive. Interactivity is the point where:
1) the page has started displaying some content,
2) the visible page elements’ event handlers have been registered, and
3) the page can now respond quickly to user actions.
Speed Index shows how quickly the contents of a page are visibly populated, for this metric, the lower the number the better.
Techniques to improve Speed index are similar to ones for TTI, but a couple of good articles: Optimizing Content Efficiency shows how modern web pages contain an increasing amount of data and techniques that can be applied for optimizing content efficiency. Optimizing the Critical Rendering Path will delve into techniques to deliver the first pixels to the screen as early as possible.
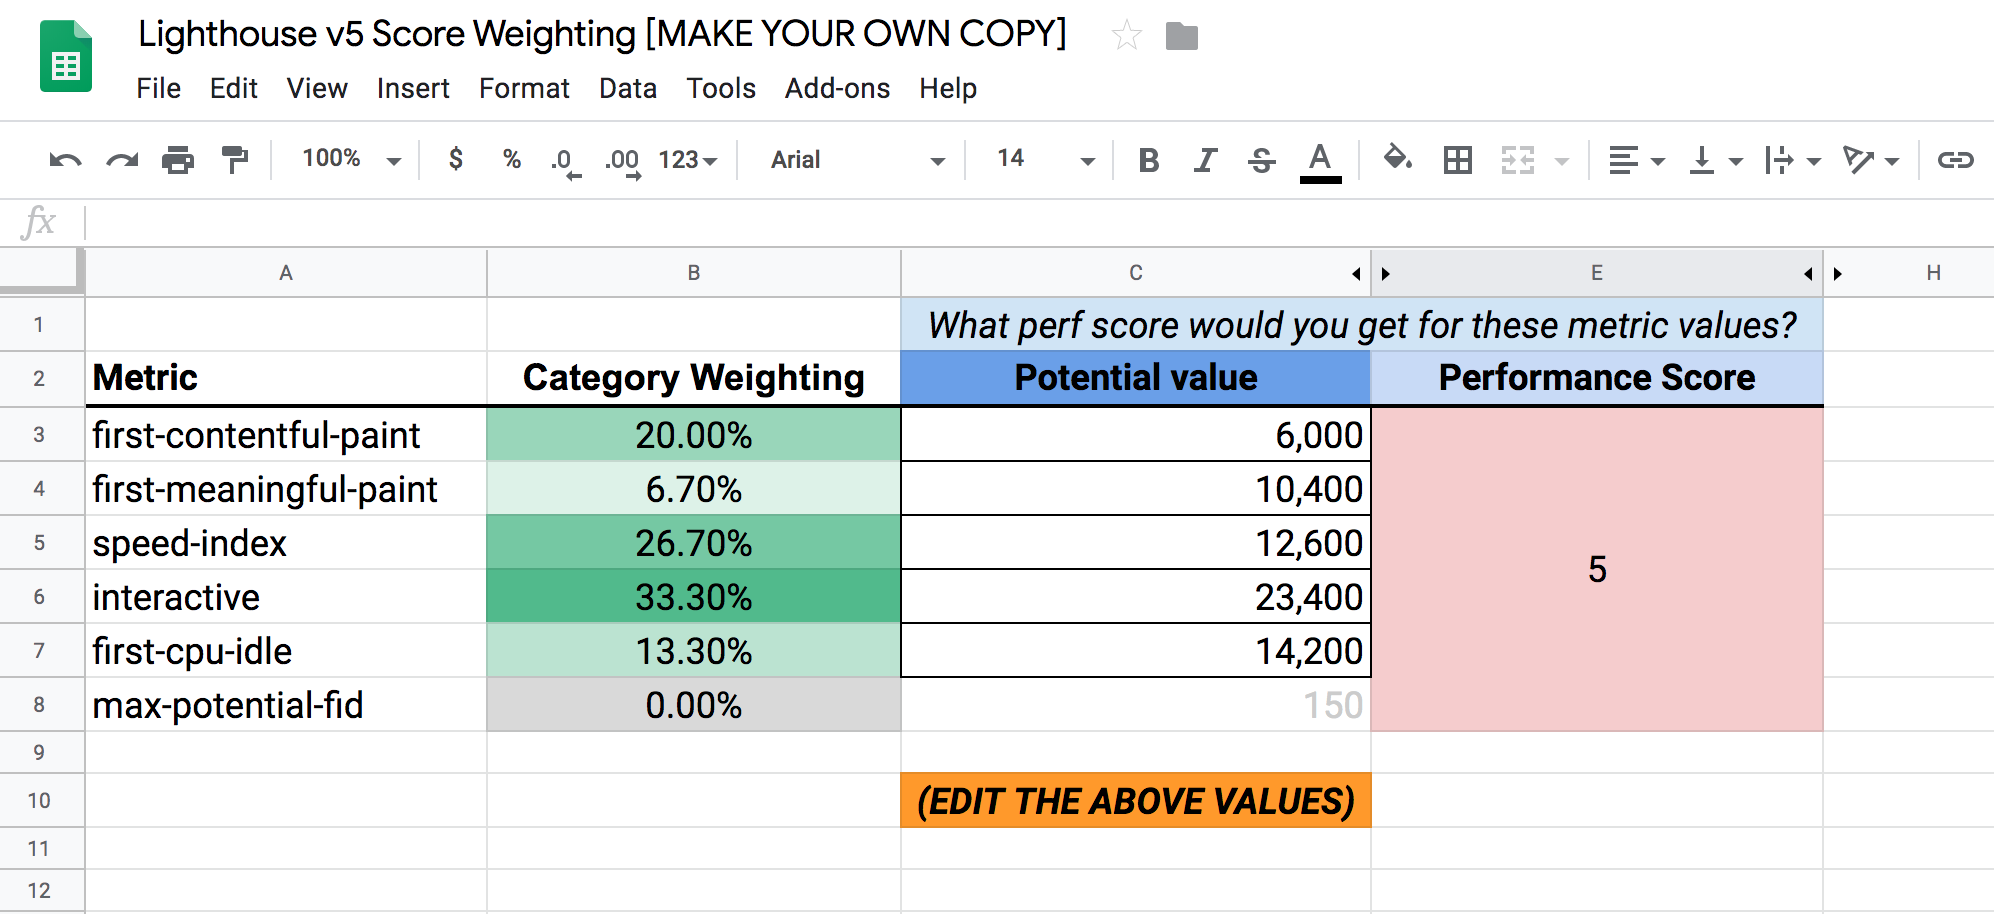
Tip #1 - The secret Lighthouse Calculator - Well it’s not really secret, but not many know about it’s existence.
The Lighthouse team created a spreadsheet that can guide you in measuring and planning your speed improvements. The Lighthouse v5 Score Weighting worksheet (image below) is a tool that helps one understand the numbers to be aiming for to achieve a particular Lighthouse performance score.
To achieve a particular performance score, play with the values in the Potential value column (in milliseconds), and it will calculate the performance score taking into account the 5 metrics and its corresponding weights.
This is the same calculation that Lighthouse uses, so yeah it will prove handy in your mission to improve your site, and get the performance score you want, without guesswork.
Figure: Lighthouse v5 Score Weighting Worksheet
First Contentful Paint (weight 3X)
First Contentful Paint (FCP) marks the time at which the first text or image is painted. From when a user navigates to a page until such time that something appears on the DOM, this is FCP, and marks a milestone for the user and gives feedback that something is happening and the page is actually loading. The lower the metric the better.
Techniques to improve FCP are similar to TTI and SI as they try to achieve similar outcomes.
The idea is to load early at the start, if nothing but to provide the illusion that the page is loading quickly. A few articles are worth reading: CSS Rendering Best Practices explains the effect of CSS on your page and techniques on how to speed things up a bit. Loading Third-party Javascript gives some useful insights into 3rd party libraries such as tag manager and analytics software and the delays it contributes to the loading experience.
First CPU Idle (weight 2X)
First CPU idle is defined as the first point at which the page is minimally interactive. Whereas TTI measures the time when the page become fully interactive, Fist CPU Idle measures the time when some items have loaded on the screen and the page now contains interactive elements.
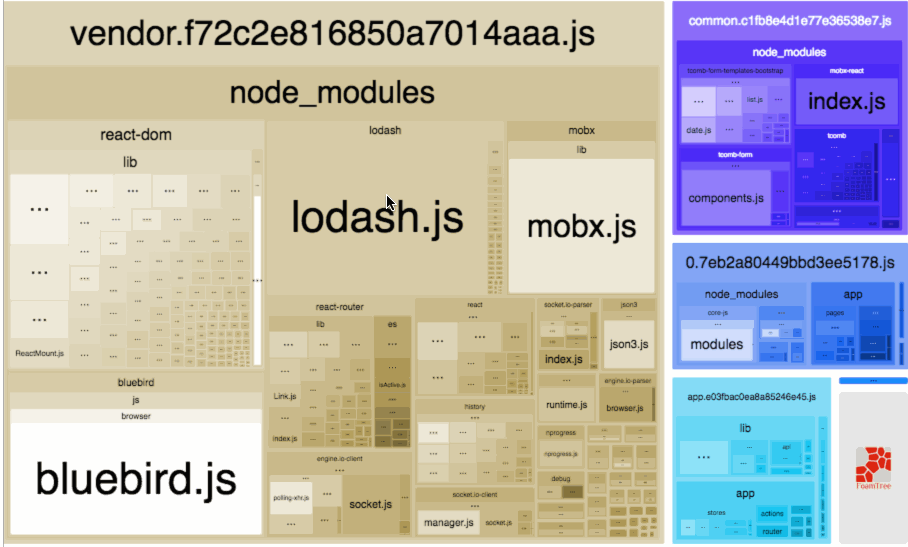
Tip #2 - Webpack Bundle Analyzer - Webpack plugin and CLI utility that represents bundle content as convenient interactive zoomable treemap. This nifty tool works because it presents the output visually, an interactive map of your bundles showing their sizes in relation to each other. So it is quite obvious since large bundles will stick out.
Webpack Bundle Analyzer
First Meaningful Paint (weight 1X)
First Meaningful Paint (FMP) is similar to FCP, measures the time the first meaningful item on the screen. The meaning of meaningful though is vague, depends the type of your site. But in simple terms is the primary content of your page.
Primary Content Detection
First Input Delay (weight 0X)
Whereas FCP and FMP are designed to measure how fast your site can put up pixels on the page, therefore how fast your page loads, First Input Delay is measuring the time when those pixels are ready and responsive to user interaction.
Because Javascript is single threaded and everything happens on the main thread, when it is busy, everything has to wait until it is free for other tasks such as responding to user input.
The lower the value of this Input Latency, the faster your site feels to the user.
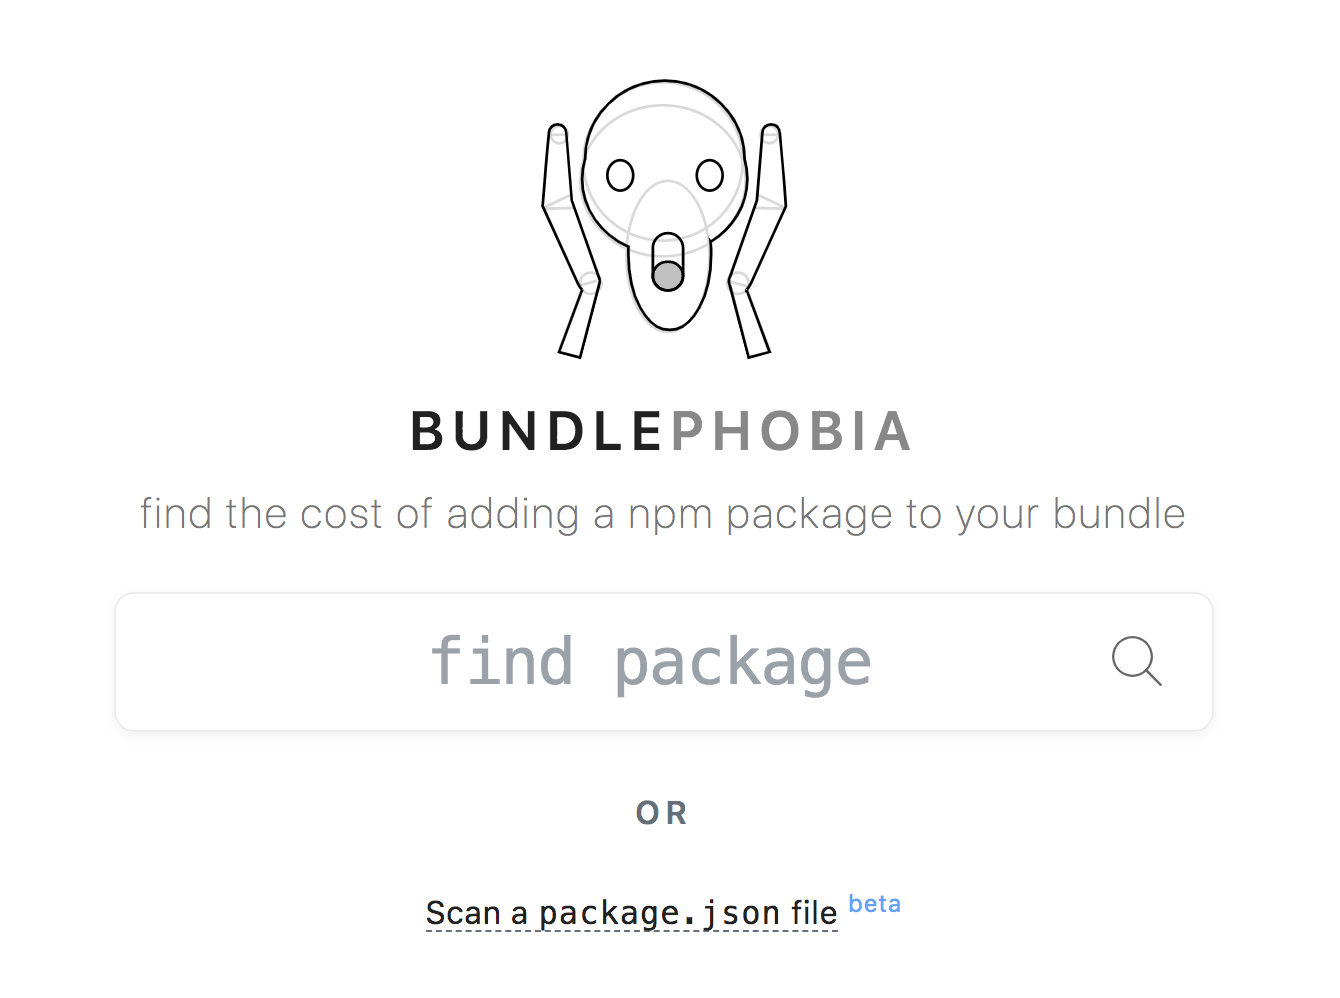
Tip #3 - Bundle Phobia - Bundle Phobia is a web application that calculates the size of an NPM package including its size minified, and gzipped, and estimates it’s download times. This is a tool that every JS developer needs!
Bundle Phobia Utility
Conclusion
In this post, we explored Lighthouse, the open-source utility that Google made available in Chrome.
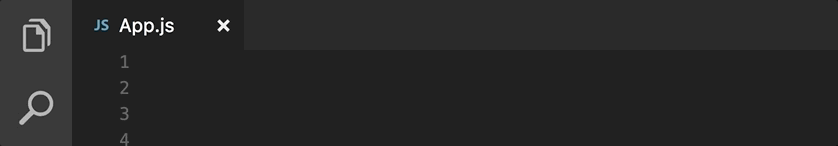
Bonus Tip - Import Cost VSCode Extension - This VSCode extension will display inline in the editor the size of the imported package. Another tool that will be an asset to the gun JS developer.
We build a recommender system from the ground up with matrix factorization for implicit feedback systems. We then deploy the model to production in AWS.
We build a recommender system from the ground up with matrix factorization for implicit feedback systems. We put it all together with Metaflow and used Comet...
Building and maintaining a recommender system that is tuned to your business’ products or services can take great effort. The good news is that AWS can do th...
Follow along as I implement DynamoDB Single-Table Design - find out the tools and methods I use to make the process easier, and finally the light-bulb moment...
Speeding up your site is easy if you know what to focus on. Follow along as I explore the performance optimization maze, and find 3 awesome tips inside (plus...