How to Build, Train and Deploy Your Own Recommender System – Part 2
We build a recommender system from the ground up with matrix factorization for implicit feedback systems. We then deploy the model to production in AWS.

In the previous article, Website Performance Series - Part 1, we’ve seen how a slow-loading website can have an adverse effect on your page’s conversions. This will lead to an increase in your visitor’s frustration prompting them to abandon your site for your competitor’s.
For the rest of this series, we will be talking about techniques to improve website performance, and NOT techniques for website optimization (using tools such as Optimizely, Adobe Target and Google Optimize). These tools are mainly used by marketing teams for experimentation to increase page and site conversions. Typically, you will only start optimizing your website with these tools once you have maximized your site’s loading speed.
Although these tools may ultimately improve page conversions, they may have a negative effect and can actually slow down your page to some extent, so it may be a counter-intuitive exercise, and best left to be discussed in more detail perhaps in a future post.
Google has produced several tools to help you discover gaps in your site performance. Because ultimately your site was designed with for an audience, and not just for one person, your site performance may be highly variable due to many factors and multitude of users.
Visitor’s devices and network latency can affect your site performance however this might not be always obvious in a lab environment.
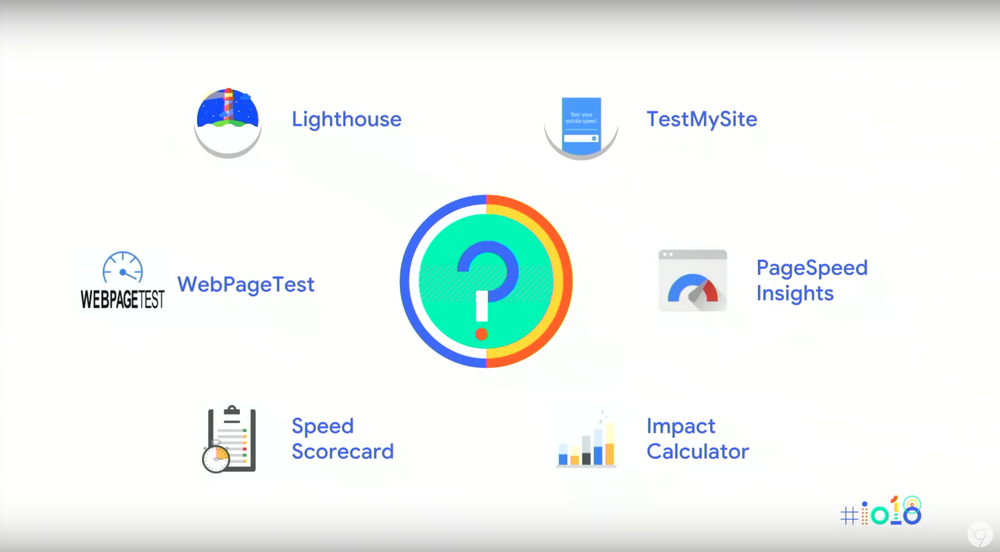
Google has built tools that can collect both lab data for discovering fundamental performance issues and field data for identifying real-world performance. Here’s a link to the following Google Speed Tools which contains a guide on usage.
Using a combination of these tools like Lighthouse, PageSpeed Insights and Test My Site can give you a pretty good idea of your site’s performance in all sorts of environments, and present you with suggestions to improve. The idea is you can run these tools repeatedly as you improve your site.

PageSpeed Insights combines tests from Lighthouse (for lab data) and Chrome User Experience Report (for real-world field data) on both mobile and desktop devices and provides suggestions on how things can be improved.

Lighthouse is a tool that you can run against your site as it performs audits against performance, accessibility, PWAs and more.
It can be installed as a CLI and has a neat feature called LightWallet which allows you to create a performance budget to enable you to set build pass, warning or failure as you push your code through your CI/CD.
It’s great to be able to run all these tools to help us improve our sites, however, if we don’t persist with these efforts, we will easily regress over time.
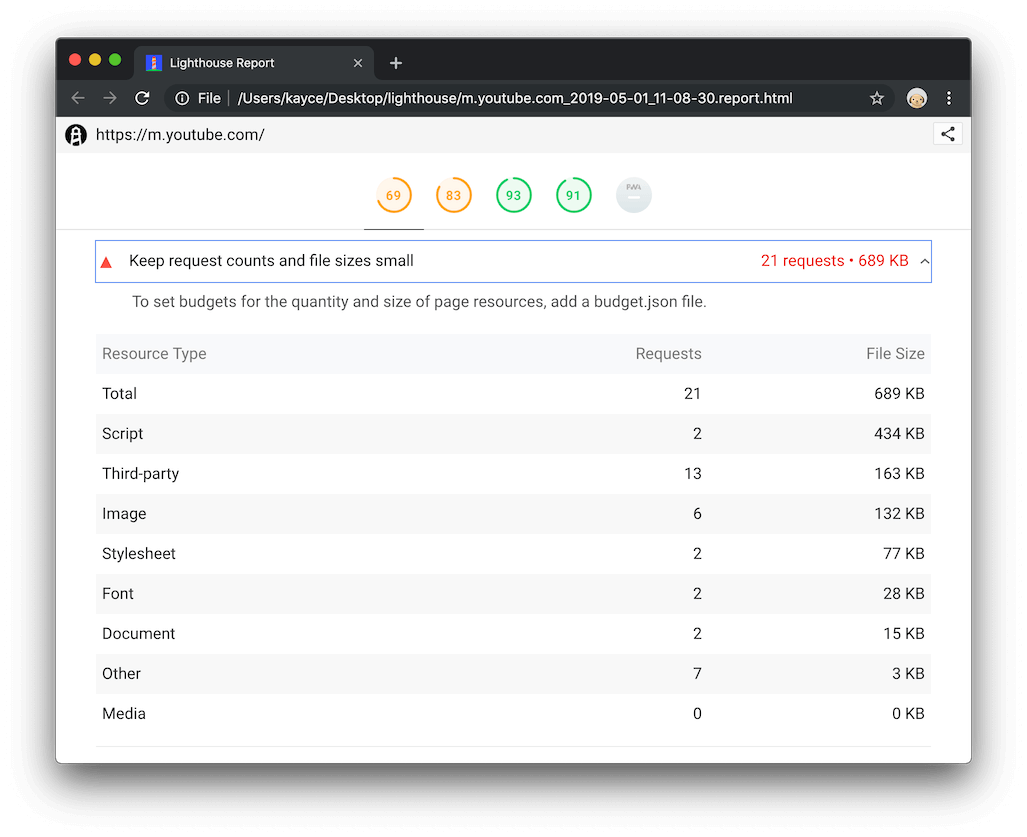
What’s good about Lighthouse is that you can add performance budgets and can easily build this into your CI/CD system. Anytime you go close or get over your set budget, you will know immediately, the fast feedback is there for one to take immediate action. This Lighthouse audit is called Keep Request Counts Low And File Sizes Small and as shown in the image below, produces a list of request count and sizes from different resource types that make up your page.
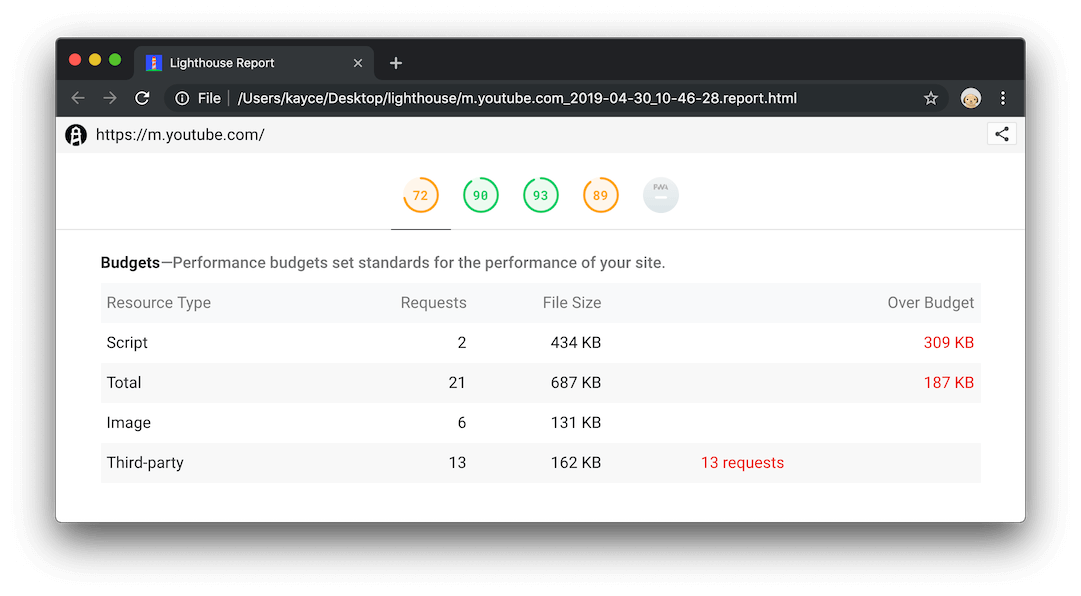
And as shown in the following, where a project’s performance budget is specified, shows a summary of your results against your budget, and your results exceeding the budgets in RED.
In this post we have explored some of the tools made available to us from Google. PageSpeed Insights combines the results from a lab-like environment (courtesy of Lighthouse), with real-world field data (from Chrome UX Report) for a result that is more representative of your audience and their devices.
Lighthouse, on the other hand is my pick for the most comprehensive tool available with additional points for also being very easy to integrate into CI/CD systems.
Because these tools make it extremely easy to run audits against your sites, there is no excuse!
Let’s get auditing now!
We build a recommender system from the ground up with matrix factorization for implicit feedback systems. We then deploy the model to production in AWS.
We build a recommender system from the ground up with matrix factorization for implicit feedback systems. We put it all together with Metaflow and used Comet...
Building and maintaining a recommender system that is tuned to your business’ products or services can take great effort. The good news is that AWS can do th...
Provided in 6 weekly installments, we will cover current and relevant topics relating to ethics in data
Get your ML application to production quicker with Amazon Rekognition and AWS Amplify
(Re)Learning how to create conceptual models when building software
A scalable (and cost-effective) strategy to transition your Machine Learning project from prototype to production
An Approach to Effective and Scalable MLOps when you’re not a Giant like Google
Day 2 summary - AI/ML edition
Day 1 summary - AI/ML edition
What is Module Federation and why it’s perfect for building your Micro-frontend project
What you always wanted to know about Monorepos but were too afraid to ask
Using Github Actions as a practical (and Free*) MLOps Workflow tool for your Data Pipeline. This completes the Data Science Bootcamp Series
Final week of the General Assembly Data Science bootcamp, and the Capstone Project has been completed!
Fifth and Sixth week, and we are now working with Machine Learning algorithms and a Capstone Project update
Fourth week into the GA Data Science bootcamp, and we find out why we have to do data visualizations at all
On the third week of the GA Data Science bootcamp, we explore ideas for the Capstone Project
We explore Exploratory Data Analysis in Pandas and start thinking about the course Capstone Project
Follow along as I go through General Assembly’s 10-week Data Science Bootcamp
Updating Context will re-render context consumers, only in this example, it doesn’t
Static Site Generation, Server Side Render or Client Side Render, what’s the difference?
How to ace your Core Web Vitals without breaking the bank, hint, its FREE! With Netlify, Github and GatsbyJS.
Follow along as I implement DynamoDB Single-Table Design - find out the tools and methods I use to make the process easier, and finally the light-bulb moment...
Use DynamoDB as it was intended, now!
A GraphQL web client in ReactJS and Apollo
From source to cloud using Serverless and Github Actions
How GraphQL promotes thoughtful software development practices
Why you might not need external state management libraries anymore
My thoughts on the AWS Certified Developer - Associate Exam, is it worth the effort?
Running Lighthouse on this blog to identify opportunities for improvement
Use the power of influence to move people even without a title
Real world case studies on effects of improving website performance
Speeding up your site is easy if you know what to focus on. Follow along as I explore the performance optimization maze, and find 3 awesome tips inside (plus...
Tools for identifying performance gaps and formulating your performance budget
Why web performance matters and what that means to your bottom line
How to easily clear your Redis cache remotely from a Windows machine with Powershell
Trials with Docker and Umbraco for building a portable development environment, plus find 4 handy tips inside!
How to create a low cost, highly available CDN solution for your image handling needs in no time at all.
What is the BFF pattern and why you need it.